Meta-Analysis of Genome Wide Association Studies
Previously we conducted a genome wide association study (GWAS). Genome-wide association studies are useful for detecting common variants in complex diseases. Meta-analysis of multiple genome-wide association studies increases the power of detecting rare variants and reduces false positives.
Today we will conduct a meta-analysis of two previously conducted prostate cancer GWASs in humans.
Download METAL
cd
curl -O http://csg.sph.umich.edu/abecasis/Metal/download/Linux-metal.tar.gz
tar -xvzf Linux-metal.tar.gz
sudo mv generic-metal/metal /usr/local/bin/.
Download a prostate cancer dataset and unpack
curl -O https://de.cyverse.org/dl/d/9DEF6A65-F0A7-4C6E-8633-957C118FD1B3/meta_GWAS.tar.gz
tar -xvzf meta_GWAS.tar.gz
cd ~/meta_GWAS
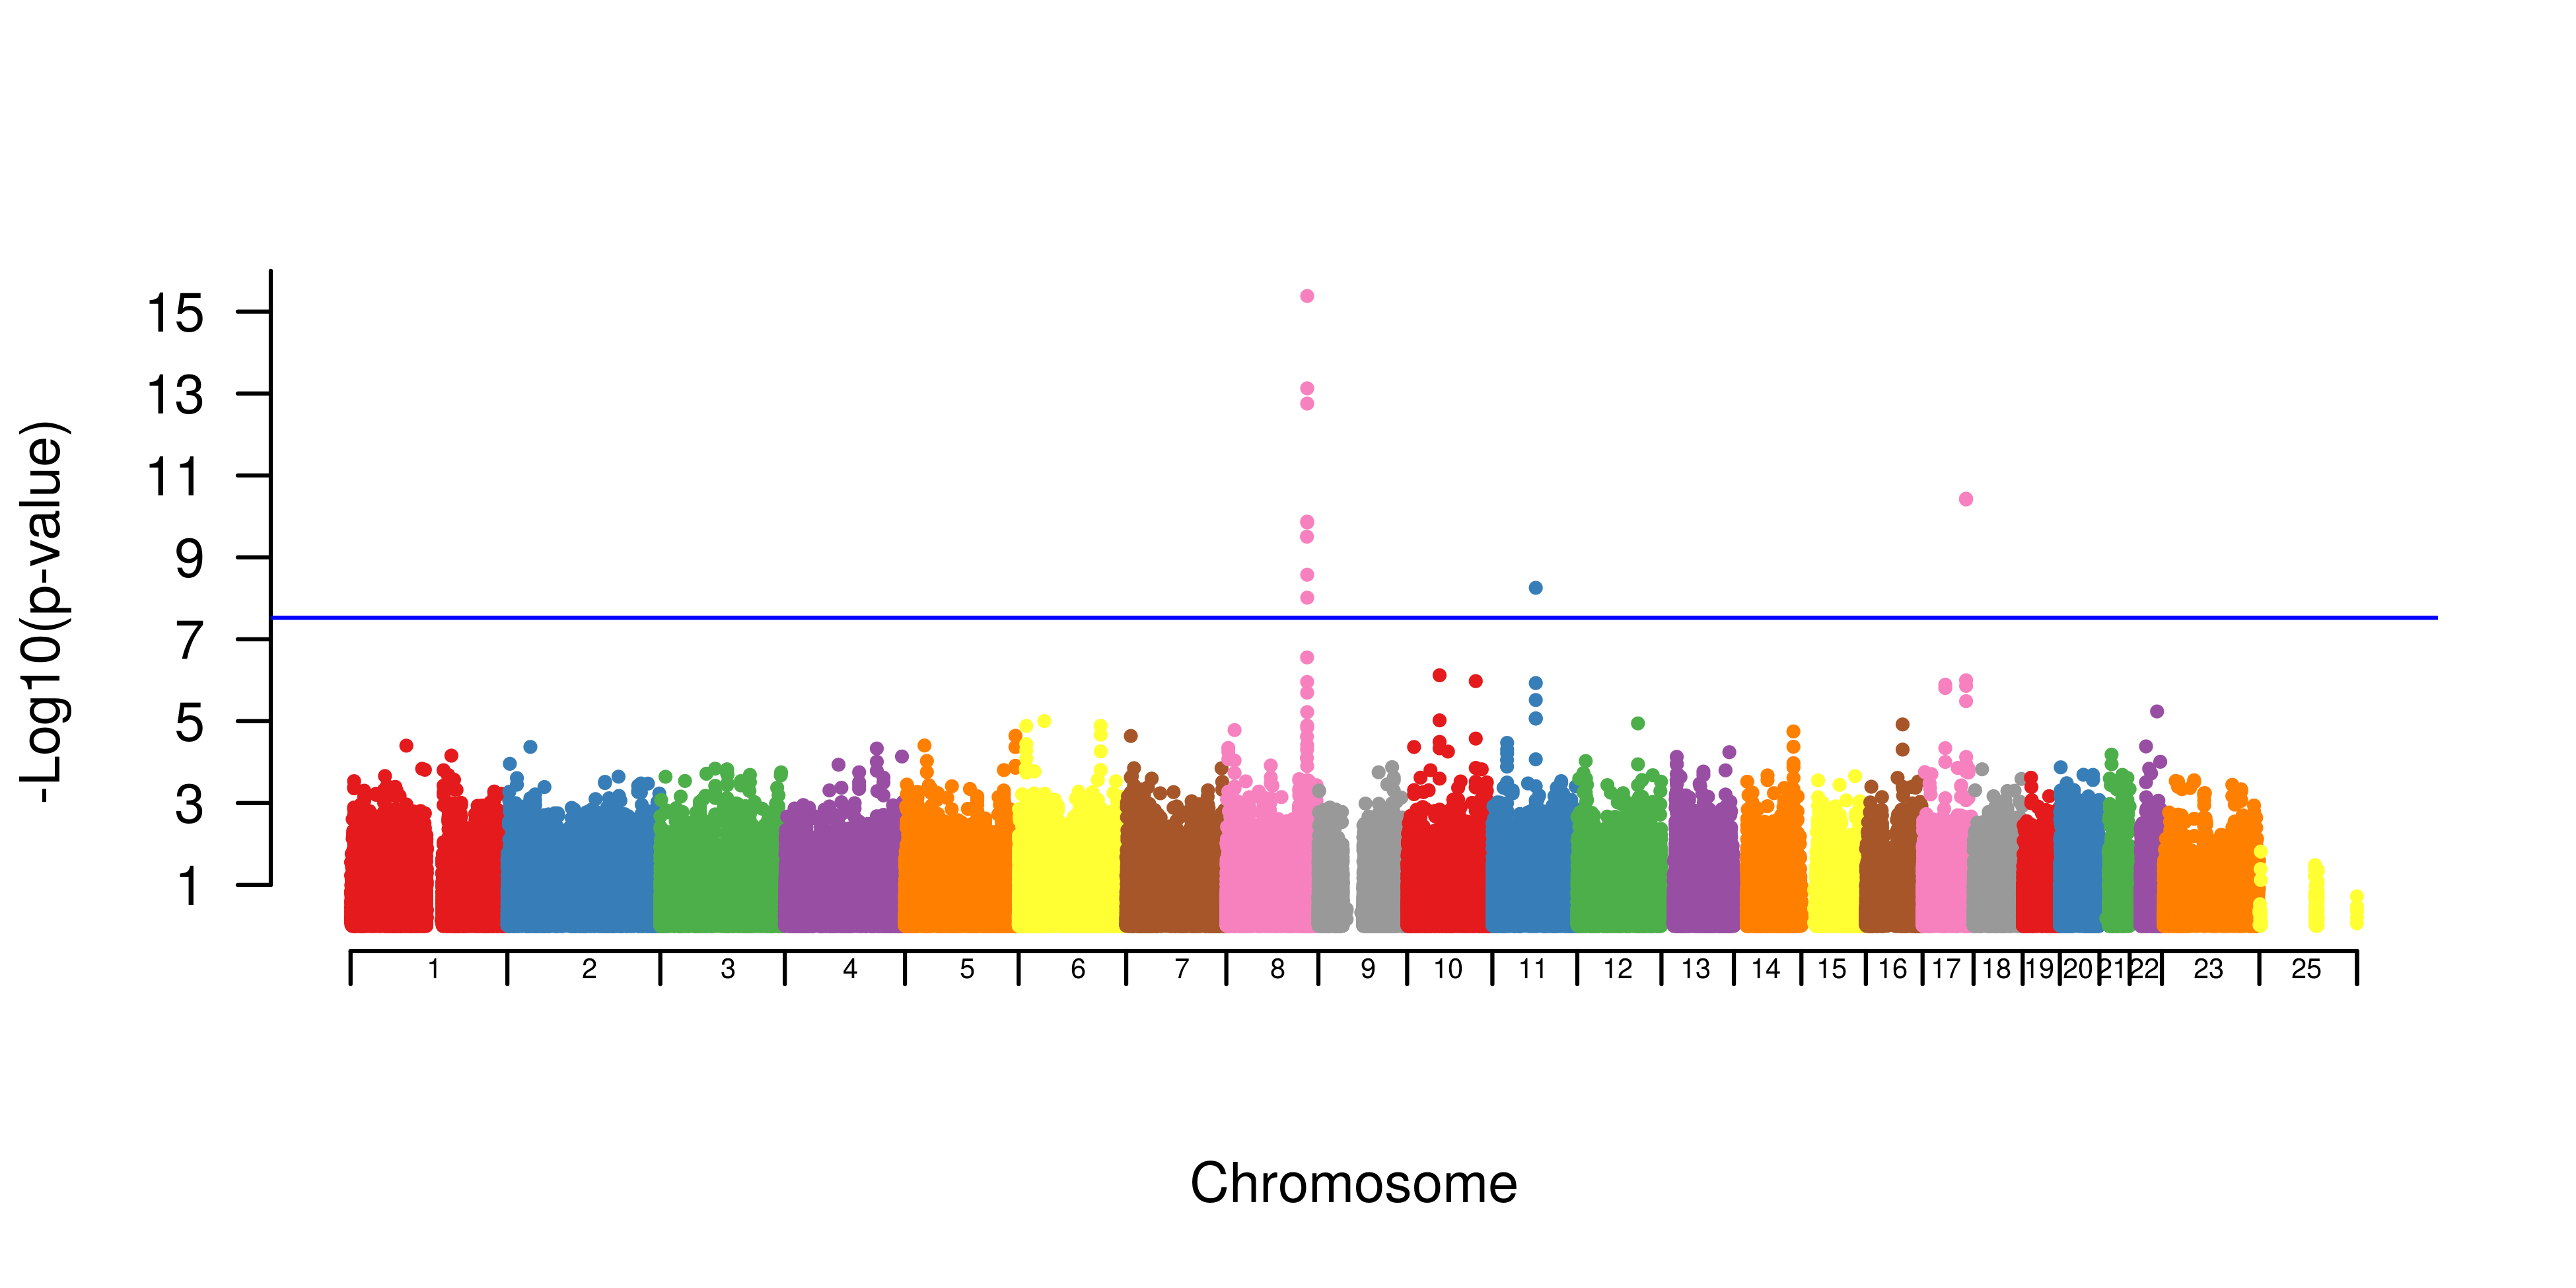
Let’s look at each study’s manhattan plot.
** Study1:prostate-606 **
** Study2:prostate-396 **
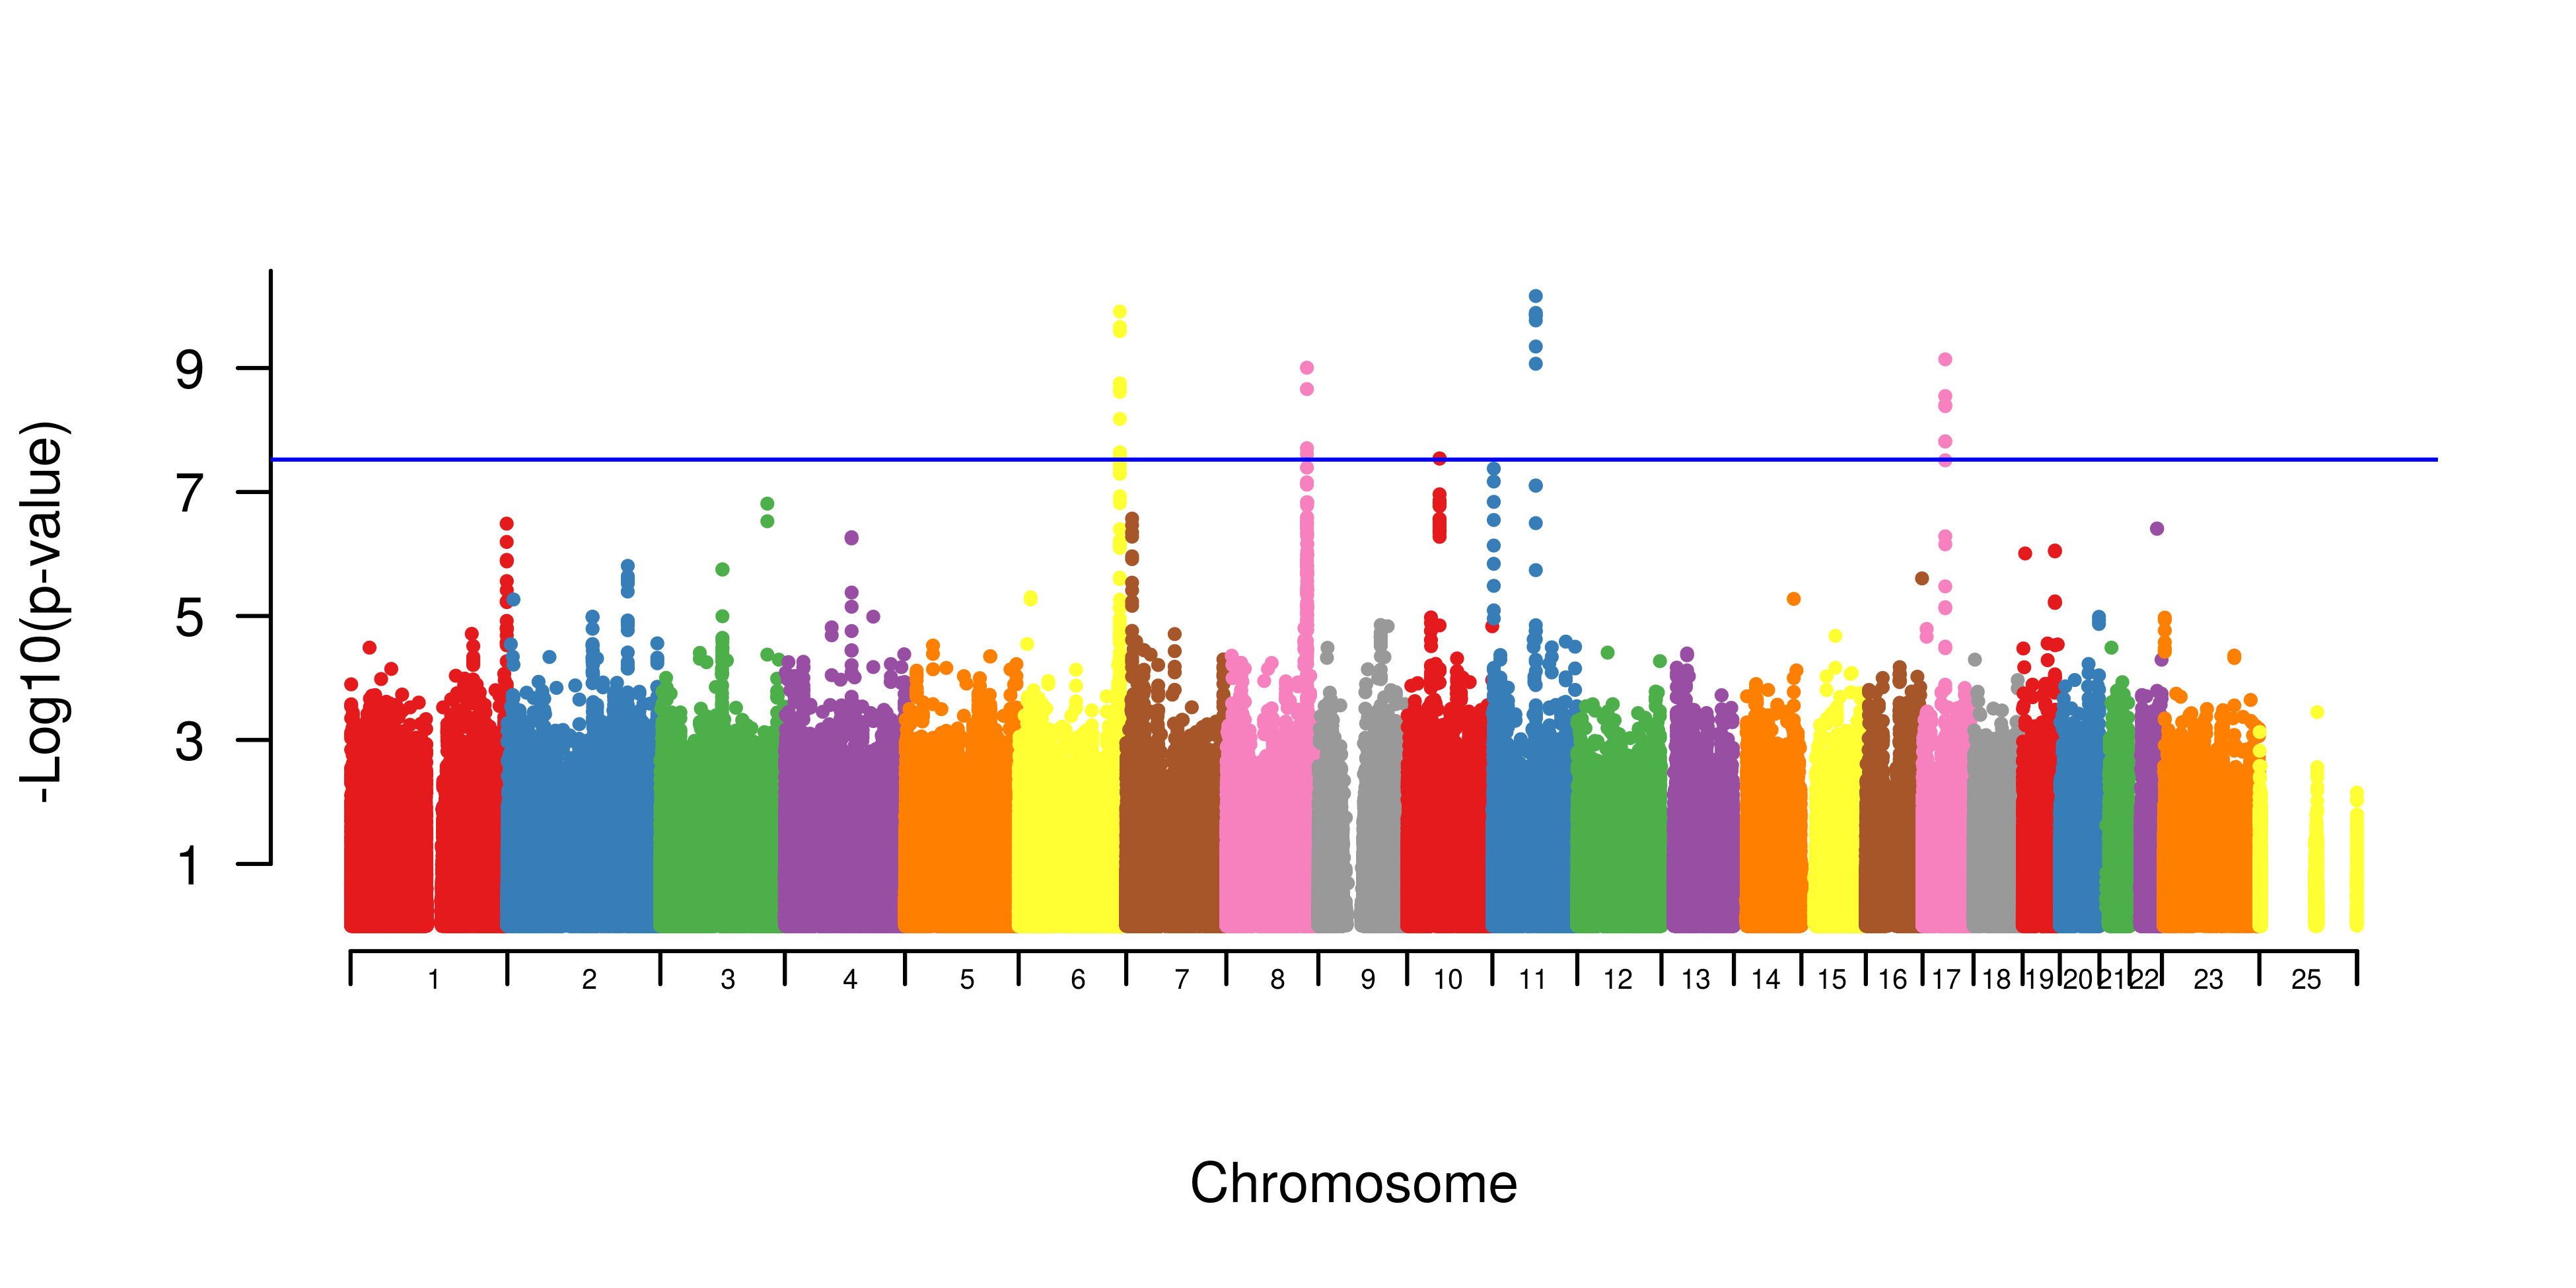
We may be able to use the power of meta-analysis to resolve some of the questionably significant markers.
Let’s use METAL to run a fixed-effect meta-analysis weighted by sample number fore each study.
Note: it is important to investigate what type of meta-analysis is most appropriate for your study, as each kind has limitations. For example, fixed effect meta-analyses will be biased under a large amount of heterogeneity.
Run metal
Start METAL:
metal
and press enter to access the program.
Next, lets tell METAL what files to read in and a little bit about the files:
# METAL commands
# READ in 606 data
SCHEME STDERR
MARKER SNP_ID
ALLELE Allele.1 Allele.2
EFFECT beta
STDERR SE
PROCESS prostate_606.assoc.logistic

# READ in 733 data
MARKER SNP
ALLELE A1 A2
EFFECT BETA
STDERR SE
PROCESS prostate_396.assoc.logistic

ANALYZE
Now exit the program by typing
quit
and hitting the return key.
We can see our meta-analysis results in the METAANALYSIS1.TBL file.
Visualize Meta-Analysis Results
First, we need to install one more R package RColorBrewer.
sudo Rscript -e "install.packages('RColorBrewer', contriburl=contrib.url('http://cran.r-project.org/'))"
Now we can create a manhattan plot from our results.
Rscript create_manhattan.R METAANALYSIS1.TBL
This will take a minute.
Now lets view our plot in the RStudio server tab!
setwd("/home/tx160085/meta_GWAS")
openPDF("METAANALYSIS1.TBL.allChrs.manhattan.png")